Presence & Analytics
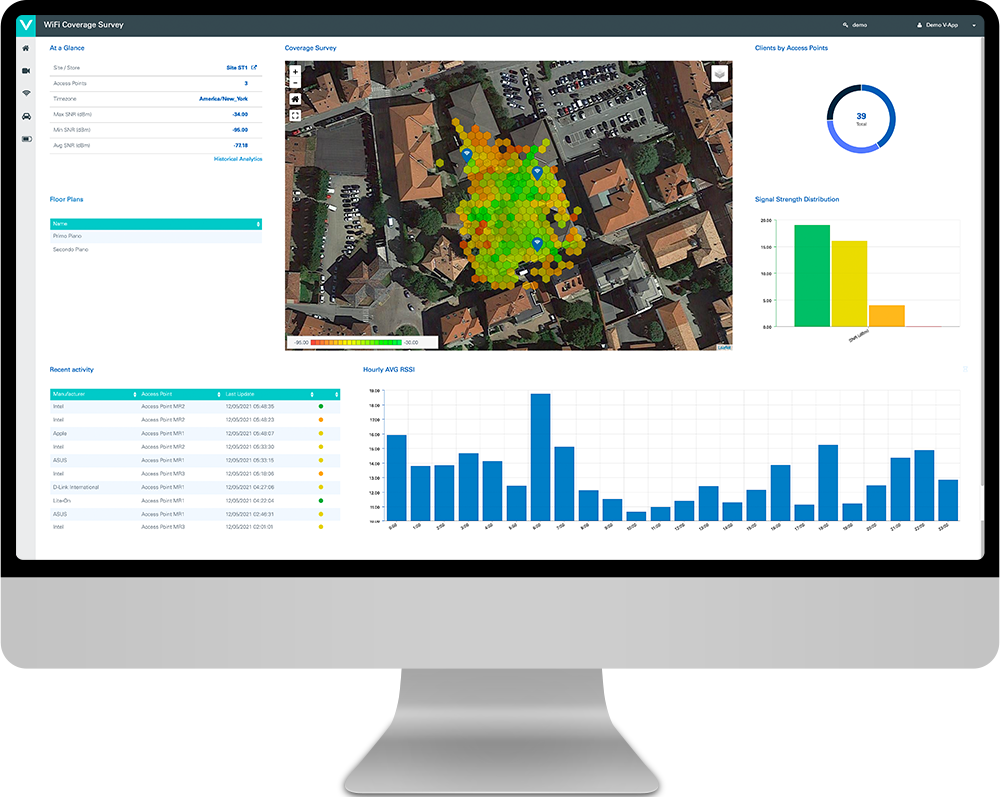
The last years have seen a quick growth of wireless networks as a prominent business driver. Thanks to a large amount of data at its disposal, Wi-Fi offers businesses plenty of growth opportunities. V-App Wi-Fi Presence and Analytics provides you with real-time data giving an unprecedented level of insight into consumer behavior and opportunities to engage customers directly.
By accessing V-App Live Dashboard you can monitor dwell times, count footfalls by the hour and compare data from multiple sites.

No credit card required.
Gain complete visibility into the network, from headquarters to remote stores to warehouses, through the V-App centralized dashboard.


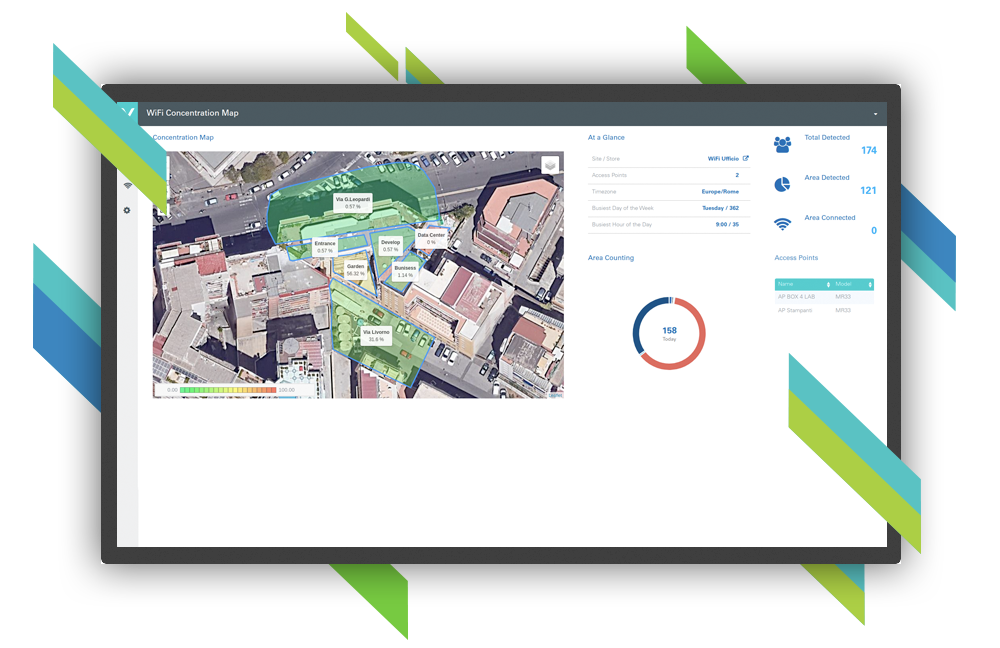
Get insights on your users’ concentration and movements by analyzing their behaviors with the help of interactive maps.
A concentration map chart can be used to visualize how users aggregate in certain areas allowing for further analysis. Seeing and analyzing your business data in the context of its location can help you understand your business in new ways.
The advantage of signing up
By registering you will be able to access exclusive contents and dedicated services.
Creating an account is free and easy, join us now.

Instant demo

Free trial
Take advantage of a free trial for the product of your interest. There’s no charge to start a V-App product evaluation.

Marketing collateral
Brochures, videos, datasheets, case studies, manuals and much more. A collection of media for a better understanding of V-App.

Schedule a call
Ask a question or schedule a call with our team. Register for an assisted demo to discover how V-App can help your business.

